

Home Services Solution Store


Browse our Solution Store for helping with homework. Download complete homework for help solutions, math answers, or pay for an assignment instantly.

XYZ
A technical walkthrough for setting up a Java-based management system that tracks customer records, purchases, and loyalty points using a GUI-driven interface and object-oriented programming.
Java Based Jewelry shop management system where, The Jewelry Shop Management System is a Java-based application designed to help jewelry store owners efficiently manage customer information, sales records, and loyalty programs. Traditional methods of record-keeping, such as manual logs or spreadsheets, are often prone to errors and inefficiencies. This system provides a digital solution by storing customer details, purchase history, and loyalty points in an organized manner. The program uses file handling to ensure data is saved permanently, even after the application is closed. By automating key tasks like loyalty point calculations and sales tracking, the system reduces manual work and minimizes mistakes. The goal of this project is to create a simple yet effective tool that improves the daily operations of small to medium-sized jewelry businesses.
XYZ
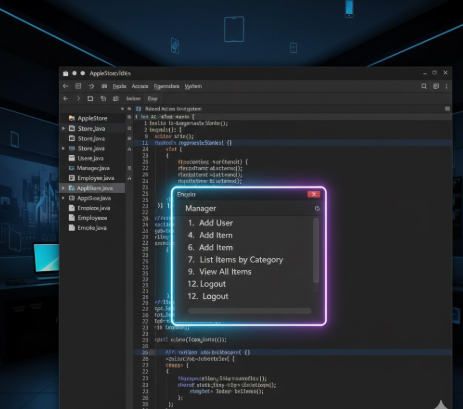
A detailed technical guide for setting up a role-based AppleStore management system and a Java-based car loan amortization calculator, covering environment setup, source code logic, and financial testing scenarios.
Introduction The goal of this project assignment is to consolidate the knowledge and skills you learned throughout the course. You will be implementing a Java application for managing a store in two phases. A team of two students will work together on each phase without any external help except from the course instructor or TA. The theme of the store and the content will be chosen by the team. The objective of this first phase of the project is to develop the following skills. Ability to design and implement larger applications using the Object-Oriented Programming (OOP) Paradigm. Use UML class diagrams to design applications. Ability to test and debug applications. Ability to save application data to and load them from stored files. Ability to work in teams. This assignment counts as 10 points of your final grade. The remainder of this document will describe the requirement for this project (Phase 1). Store Name and Contents Your first task is to decide on the type of content you want to sell on the store. This will determine how your items are printed (and displayed in Phase 2), and how your store will be organized. You should explicitly list all item that will be available. In addition, you will need to chose a name for your store. System Specification Your application must support the following features: Allows loading the application data from a file (if the file is not specified load the data from the file ''store.data'') Allows saving the application data from a file (if the file is not specified save to the default file'store.data'") There are three types of users: Managers, Employees, and Customers. All users have an and a name. Managers and Employees need to login with an ID and a password ID . Customers only need their ID to login. All users can perform the following - List store items by category - Search store items by name or price, or any attribute you think is important for your specific store. - log out • In addition, Managers and Employees can perform the following - Add store items - Remove store items Create a new Customer account • Managers can add and remove users (i.e, Managers, Employees, Customer), except themselves If there is no file to load data from, by default the store will have no items and only a single Manager user named "owner" with an ID "1", and a password "owner".
XYZ
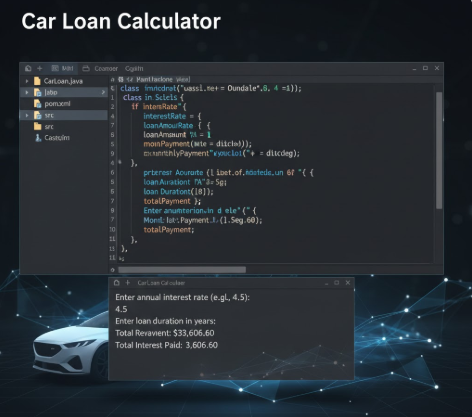
A comprehensive walkthrough for setting up and running a Java car loan calculator project. This guide covers environment configuration, file preparation, and a detailed explanation of loan amortization calculations, including monthly payments and interest overpayment.
Car Loan Write a Java program using [intelli] that calculates a monthly car payment; we will assume that the interest rate is compounded monthly. Use the Scanner class to receive the input and produce the output using System.out.println. 1. Prompt the user for a double value representing the annual interest rate in percentage. For example, user enters 5 for 5%. 2. Prompt the user for an integer value for the number of years the car loan will be held (typical input here is 3 or 5). 3. Prompt the user for a double value representing the car loan amount borrowed from the bank. 4. Calculate the monthly payment using the formula: o Monthly payment = (mIR * P) / (1 - (1 / (1 + mIR)(12 * nOY))), where: o mIR = monthly interest rate = annual interest rate / 12 (Note that the interest rate should be stored as a decimal. For example, 0.05 for 5%). o nOY = number of years o P = car loan amount (also called the principal) o Hint: The Math class has a pow method (power) that you should use here 5. Output a summary of the car loan results as follows: o the annual interest rate in percent notation o the car loan amount in dollars o the number of monthly payments (no decimal places) o the month payment in dollars with exactly two significant digits after the decimal point o the total payment over the years with exactly two significant digits after the decimal point o the overpayment, i.e., the difference between the total payment over the years and the car loan amount, with exactly two significant digits after the decimal point o the overpayment in percentage (in percent notation) of the car loan amount, i.e., the ratio between the overpayment and the total payment o Format currency and percentages appropriately, using $ and % where necessary. Number formatting reference is available on the Java API. 6. Format the input (including prompts) and output as shown on the sample below. Numeric outputs are formatted using the DecimalFormatter class. 7. Comment your code properly. Sample execution: CAR LOAN PROGRAM ===================================== Enter the interest rate: 3.5 Enter the number of years for the loan: 5 Enter the car loan amount: 45,999 ===================================== Annual Interest Rate = 3.5% Car Loan = 45999.00 NumberofmonthlyPayments=60 MonthlyPayment= $836.80 Total Payment = $50208.12 Overpayment = $4209.12. Overpayment in % = 8.38%

XYZ
Problem 1: Please finish the tasks below using both Python and R: 1. Generate a 150 by 1 vector following standard normal distribution. (Please set a random seed to make your generation reproducible) 2. Output its average, variance, quartile, and mean absolution deviation. 3. Make a histogram for the data you generated. 4. Convert this vector to a 50 by 3 data frame and print it. 5. Assume each column represents a group. Make a boxplot to compare these groups, and describe your observations. Problem 2: Please finish the tasks below using both Python and R: 1. Input the data below (the first row is the name of each variable). 2. Select two variables and make a scatter plot. (e.g., "mpg" and "cy!") 3. Perform PCA to extract features from the data (using the first three PCs), and print the features (1.e., the PC scores).
XYZ
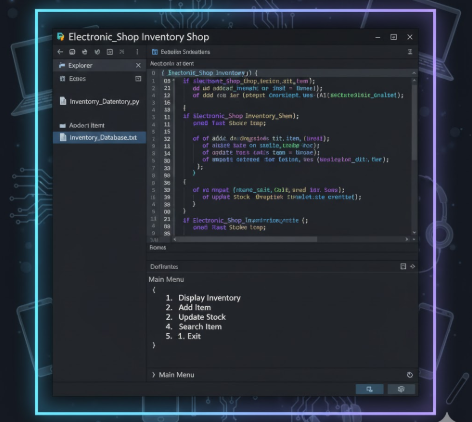
This report details the development of an Electronic Inventory Shop system, a Java-based application designed to categorize sales based on customer age. The project utilizes Java Swing to create a custom graphical user interface (GUI) that sorts purchases into two distinct categories: a "Kids List" for children aged 11 or younger and an "Items List" for older customers. Key features include: Age-Based Categorization: Logic that automatically sorts products like toy balls into the Kids List and more advanced items like remote-controlled cars into the Items List. Custom GUI Design: A manually structured interface using JPanel and other Swing components to handle user inputs effectively. Inventory Management: A simplified retail system focused on tracking age-appropriate product sales and purchasing patterns. Educational Foundation: A demonstration of applying conditional logic and GUI design to solve practical retail management problems.
Background In a retail environment, managing inventory effectively often requires categorizing sales based on customer demographics to better understand purchasing patterns and ensure age-appropriate product distribution. For an electronics shop, distinguishing between items bought by children and those bought by older customers is essential for organizing stock and tailoring marketing strategies. Manual tracking of these demographics can be inefficient and prone to error, necessitating a digital solution to streamline the process. Problem Current inventory methods at the shop do not automatically differentiate between products based on the buyer's age, leading to a disorganized sales record where simple toys and advanced electronics are grouped together. There is a need for a software-based system that can capture user input and apply conditional logic to sort items into distinct categories automatically. Goal The objective is to develop a Java-based Electronic Inventory Shop application using Java Swing to create a user-friendly graphical interface. The system must: Capture User Input: Allow the entry of item details and the age of the customer. Apply Conditional Logic: Automatically categorize purchases based on age; specifically, items bought by children aged 11 or younger must be placed in a "Kids List". Categorize Advanced Items: Place items bought by customers older than 11 into a separate "Items List" with additional specifications. Display Results: Provide a clear visual output (via JPanel) that shows the organized inventory, facilitating easier tracking and management of age-appropriate sales.
XYZ
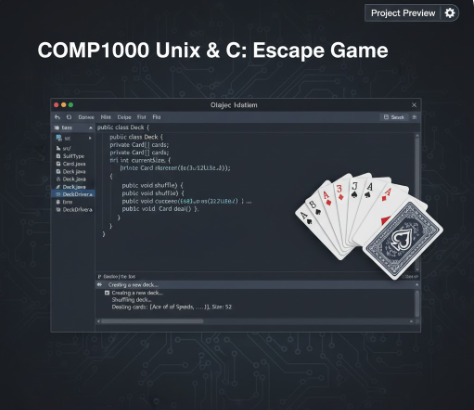
The task was to create a Java program that models a deck of playing cards, similar to those used in games like Poker or Blackjack. The program consists of four main components: the Card class, the Deck class, the DeckDriver class (which contains the main method), and the SuitType enumeration. The goal was to implement these classes based on the provided API, ensuring proper functionality for creating, shuffling, and dealing cards.
Deck of Cards Write a program using Intellij to model a deck of playing cards-the kind used in Poker or Black Jack, Download this API and unzip the file CardDeckAPL.zip Double-click on index.html to open the API. This API describes the four elements of this project: (1) the Card class, (2) the Deck class, the DeckDriver class (which contains the main method and may be renamed to your default IDE's main class name), and (4) the Sust Type enumeration Start by creating a project and add the following to the project: Asuit Type enum definition given here SuitType.java This is the enumerated type definition for a playing card's suit A Card class to represent one playing card. This class should have two constructors and a tostring method. Refer to the API to understand what these methods do A peck class to represent a deck of playing cards. Lise an array (not ArrayList) to store the cards. In addition, store the current number of cards in the deck as a second instance variable, as cards are dealt, this integer will decrease. It should contain a constructor and the following methods: shuffle, deal, getSize, hazMoreCards, tostring. Refer to the API to understand what all these methods do The main method should. Instantiate an ArrayList to hold Cazu objects, ne main method snoulS instantiate an arrayList to hold Card objects instantiare the best of Cara objects shuffle the after shuffling, deal each card from the Deck and assign each card to the ArrayList after the ArrayList is filled, print the contents of the ArrayList, one Card at a time Be sure appropriate comments are in place. Add Javadoc for each class, and each method within every class. Submission: Coding guidelines Use only constructs and syntax from the textbook or from class lectures Use descriptive identifiers -Use letter-case standards for naming variables, classes, and methods -Write efficient code, do not re-create code when similar code already exists -Use white space effectively indenting blocks of code and blank lines between major sections of code Comments Add inline or block comments and non-trivial parts of your code. Testing Record your program running to prove it is running as expected, each time clearly explaining whether the output as correct or not, and why. There is no need to explain the code Academic fionesty This work is to be completed by you alone without the help of an internet resource, a friend, family member, or dassmate You may get help from the instructor, preceptor, or an official UHart tutor Any violation of the academic honesty policy will result in disciplinary actions as outlined on the syllabus Prepare for submission: Download DBS if you haven't done so Change Settings > Output> Recording Format to mp4. Add Sources > Display Capture. Note that only MP4 videos are accented --- PAGE 2 --- Download QBS you haven't done so. Change Settings > Output > Recording Format to mp4. Add Sources > Display Capture. Note that orily MP4 videos are accepted Record your program running by testing your code as explained earlier. Be sure to narrate and discuss and analyze the output, there is no need to explain your code. Be sure that audio is clear and audible. Test the MP4 to make sure video and audio work property. Limit your video to 2 minutes. If your code does not run or does not compile, create a video explaining how far you got with the code, and what happens or does not happen when program is compiled/ran Zip your entire Intellij project for this work producing a zip file. No other extensions or formats are accepted. If I unzip this file, I should be able to open your entire project using Intellij and run your code directly a. To zip a folder on Windows, right-click the folder (that contains the entire project) in File Explorer, select "Send to, and then choose "Compressed (zipped) folder This will create a new zip file with the same name as the folder, in the same location, as a compressed archive. b To zip a folder on a Mac, simply contral-click (right-click) the folder (that contains the entire project) and choose "Compress" from the shortcut menu. A new zip file with the same name (or "Archive.zip" if you're compressing multiple items) will be created in the same location Every entry below must be filled Question 1 Select one that best describes your project. Be clear and precise to get full points. [x] Code complies, rested thoroughly with varied test cases, and works according to the exact specification above [x]) Code compiles but does not pass some test cases 5 Points
Curtin University
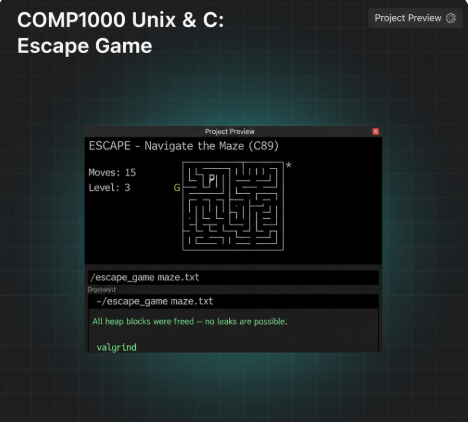
This report and assignment specification detail the development of "Escape," a terminal-based ASCII maze game created for the Unix & C Programming (COMP1000) course. Built using the C89 standard, the game requires players to navigate a character ('P') through a grid toward a goal ('G') while avoiding rotating enemies that can detect the player's movement. The project emphasizes professional software engineering practices, including dynamic memory management (malloc/free) to prevent leaks, modular code design with separate header files, and the implementation of a generic linked list to support a multi-step "undo" feature.
Your task for this assignment is to design, code (in C89 version of C) and test a program. In summary, your program will: • Able to create dynamically-allocated 2D char array to make a simple ASCII-based game. • Receive user input to control the game. • Use pre-written random number generator to initiate components in the game. • Write a proper makefile. Without the makefile, we will assume it cannot be compiled and it will negatively affect your mark. • Extract information from a text file to initialize the game. • Do a simple animation with sleeping feature in C. • Utilise linkedlist data structure to keep track the game progress, allowing the Player to undo the steps taken.

XYZ
This solution guide for CSE 2321 Homework 3 provides formal mathematical proofs and step-by-step solutions for discrete mathematics topics. It covers set theory (power sets and set-builder notation), graph theory (identifying bipartite graphs and Eulerian cycles), and mathematical induction for summation identities.
1. (5 pts) Let A = {1, 2, 3, 6} and B = {2, 3, 5, 6}. Let S be a set, and P ow(S) be the power set of S. (a) What is |P ow(A)|? (b) List the elements of P ow(A). (c) What is |P ow(A ∪ B)|? (d) What is |P ow(A ∩ B)|? (e) List the elements of P ow(A \ B). 2. (10 pts) Let N be the set of natural numbers (including 0). Define the following sets using set builder notation. You should do this in a way that is entirely mathematical, contains no words, and does not rely on recognizing a pattern. For example, if asked to define “The set of natural numbers divisible by 3” then {x ∈ N : x is divisible by 3} or {0, 3, 6, . . .} would not be accepted {x ∈ N : ∃y ∈ N, x ÷ 3 = y} would be accepted (a) The set of even numbers. (b) The set of prime numbers. Recall that 2 is the smallest prime. 3. (10 pts) Define sets A, B, X, Y, Z (i.e. give a specific example) which demonstrate that: (a) B ∪ A ̸= (A \ B) ∪ (B \ A). (b) Z \ (X ∪ Y ) ̸= (Z ∩ X) ∪ (Z ∩ Y ). 4. (10 pts) We say a graph G = (V, E) is bipartite if there are sets V1 ⊆ V and V2 ⊆ V such that all of the following conditions hold: • V1 ∩ V2 = ∅ • V1 ∪ V2 = V • ∀{u, v} ∈ E, [(u ∈ V1 ∧ v ∈ V2) ∨ (v ∈ V1 ∧ u ∈ V2)] 1 Show that the following graph is bipartite by finding V1 and V2 which meet these conditions. Redraw the graph so that V1 is on the left and V2 on the right. 5. (5 pts) Find an Eulerian cycle in this graph and list the vertices in the order visited by the cycle: 6. (10 pts) Using the proof techniques and format guidelines presented in lecture, prove that for all n ≥ 1 the following is true: X n i=1 1 i(i + 1) = n n + 1 . Hint: use the induction proof that Pn i=1 i = n(n+1) 2 as a guide.
XYZ
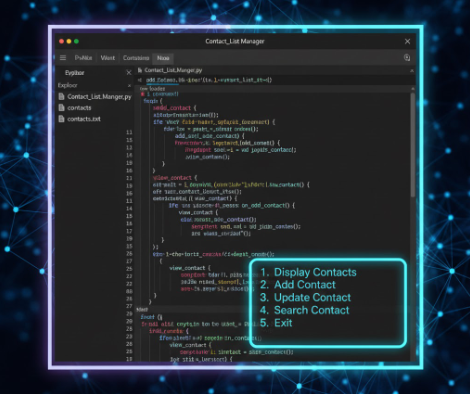
The Contact List Manager is a Python program designed to help users manage their contacts efficiently. The program allows users to perform various operations such as viewing, adding, updating, and searching for contacts stored in a text file. The program reads contact information from a file named "contacts.txt," which contains names and phone numbers separated by commas. The interface is user-friendly and menu-driven, making it easy for users to navigate and perform tasks without confusion.
Design a simple Python program to manage a contact list using a text or CSV file. The program should allow users to add, view and update the contacts. Users can enter a name and phone number while the program validates input to prevent empty names, incorrect phone numbers, and duplicate entries. Contacts should be displayed in a structured format, and users should be able to search for a contact by name. The interface should be userfriendly.


Get verified answers for your university assignments instantly.

Every homework answer is verified by our AI solver and human experts to ensure A+ grade quality.

No waiting. Search for your coding solution, pay securely, and download the PDF/Source code immediately.

Get unique solutions for helping with homework. Perfect for learning and reference purposes.
Why students globally prefer our solution store

We don't just give answers. Get detailed homework answers with logic explained, ensuring you understand the core concepts.

Looking for coding solutions? Download 100% executable code files (Python, Java, C++) verified by our best Tutors.

No waiting for tutors. Pay for an assignment solution and get the download link immediately via our secure dashboard.

Our expert-verified solutions are designed to help with homework effectively, ensuring you secure top grades in university.

We value your trust. If the Homework solution is incorrect or doesn't match the description, you can claim a full refund.
Get unique content. Every solution in our store is checked against plagiarism tools to ensure originality.