

programming
Total Results: 19
Description: Untitled
Problem Statment : You work in the shipping department for a book printer. At this printing shop, all the books are the same size. Specifically, the covers are 10 inches (length) by 8 inches (width). The thickness of the books is determined by the number of pages, which are .006 inches each. Also, the front and back covers add 1/4 inch each to the thickness of each book (1/2-inch total). Given these dimensions and additional information given by the user about the order, you are responsible for determining the packaging for orders that go out to bookstores. Note, all measurements should be in inches, unless otherwise specified. NOTE: Text must be exact. This includes capital letters, white-space, and punctuation. Please see the example at the end of this document. Also, consider the data types for each calculated result. 1) Prompt the user for the following pieces of information about a particular order: a. How many book copies in the order? b. How many pages in the book? c. What is the length of the shipping box? d. What is the width of the shipping box? e. What is the height of the shipping box? How many books in the book order? How many pages in the book? What is the length of the shipping box? What is the width of the shipping box? What is the height of the shipping box? 2) Calculate and display the volume of the shipping boxes, rounded to the nearest whole inch. The volume of the shipping boxes is __ cubic inches. 3) Calculate and display the thickness of each copy of the book, rounded to the nearest tenth. Each book is ___ inches thick. 4) Assume that the books must be stacked so that the length of the books is aligned with the length of the box and the width of the books is aligned with the width of the box. The box and the books are stacked so that their thickness corresponds to the height of the box. (This makes the task easier.) ___ books will fit in each box. To determine how many books can be packed in each box, first determine: a- How many books by length fit in a box. b- How many books by width fit in a box. c- How many books can be stacked in a box. NOTE: Only the number of books in a box is displayed to the screen. 5) Determine how many full boxes of books will be shipped and how many additional books are left over for one additional box. (Assume that there will be additional books; Do not worry about having 0 (zero) books left over.) There will be ___ full boxes and ___ books for an additional box. 6) Calculate and display the empty space (volume) in this order. (NOTE: This means that there will likely be space in the full boxes, and a different amount of empty space in the partially filled box!) The extra volume in all the boxes totals _____ cubic inches. Testing your code: When you run your program, the black text below is the prompts from the program. The blue is the input values from a user. The test cases in GradeScope will run your code with different inputs (blue) and check the results that your program generates. How many books in the book order?500 How many pages in the book?350 What is the length of the shipping box?25 What is the width of the shipping box?25 What is the height of the shipping box?30 The volume of the shipping boxes is 18750.0 cubic inches. Each book is 2.6 inches thick. 66 books will fit in each box. There will be 7 full boxes and 38 books for an additional box. The extra volume in all the boxes totals 46000.0 cubic inches. Assumptions: In computer science, exact formatting of input/output is like putting on socks with shoes, while people might not do it 100% of the time in their personal life, it is extremely unusual not to do it in a professional setting. Therefore, you will need to format your input/output exactly like the samples provided. As we are just starting to program, and don't even have if-else statements at our disposal, we will assume many things to make the project easier, though it makes the project slightly more artificial. You may assume that the user will always enter a value of an appropriate data type. Restrictions: Allowed: • All arithmetic operators: +, -, *, /, %, //, **, = • The following data types and their casting functions: int, float, string • Any Escape Sequence • These functions: input(), print(), round(), min() Prohibited: • You may not import other modules (like math) or write your own modules • You may not use string formatting operations and related functionality • You may not create your own functions (do it the long way for this project) • No branching (if statements), or loops (for/while), or any other feature we haven’t yet covered in class • Do not pre-calculate values on paper and then use the literal calculated price value in code. Do all the calculations in code. In other words, no hard coding. Testing Your Code The tester for this assignment expects exact matching to pass a test case. If you're getting the right numbers but failing test cases, check your formatting (issues, capitalization, spelling, etc) You cac to see the exact tests we'll use when we grade your code, so you might as well get them all correct before turning in your work! No surprises there. One note, tests.txt, the OUTPUT section of the tests only includes what the program is supposed to print and does not include the characters that a user would be typing during the interaction (including when the user hits enter for a newline). This makes the output look a bit weird, but the testing file is correct. To test your code with the provided tester, first make sure that you have downloaded the files "tester1.py" and "tests.txt" into the same folder as your assignment code. Then, from that directory, run the following command using your command-line interface: > python3 tester1.py your_filename_PA1.py ++++++++++++++++++++++++++++++++++++++++ ++++++++++++++++++++++++++++++++++++++++ passed 9/9 tests. NOTE For Windows users: Instead of python3, use py or python. If you pass all the tests, you will see the above contents. If you don't pass a test, you will be informed of where the mismatch in your output is, and you can figure out from there what needs to be fixed. Hints to Pass the Tester: Even if your math and your math output is correct, your program must have the exact spelling and formatting as the examples above for your code to pass the tester. Be sure to use the round() function, round(data, 2)as needed.
XYZ
$ 25
Description: Untitled
Problem Statment : Question 1: An energy consultancy collected data on 10 countries, recording population (in millions), installed renewable capacity (in GW), and the number of solar power projects completed in the last five years: Country Population (Millions) Renewable Capacity (GW) Solar Projects Completed Germany 83 120 350 China 1441 900 1200 United States 331 280 850 India 1380 150 600 Brazil 213 140 420 Spain 47 55 310 Australia 26 60 540 Canada 38 65 200 France 67 70 330 United Arab Emirates 10 15 180 Write a python program to 1. Create a Python Dictionary: Construct a Python dictionary called Countries with keys: o "Country" o "Population_millions" o "Renewable_Capacity_GW" o "Solar_Projects_Completed". 2. Build a Pandas DataFrame: Use this dictionary to create a Pandas DataFrame named DF_Countries and print it. 3. Display Initial Data: Print the first 5 rows of the DataFrame. 4. Create new columns for additional metrics: o Add a column "Capacity_per_Capita_MW" = (Renewable_Capacity_GW × 1,000) ÷ Population_millions. o Add a column "Projects_per_Million" = Solar_Projects_Completed ÷ Population_millions. o Print the header of the augmented DataFrame. 5. Perform data analysis: o Identify and print countries with Capacity_per_Capita_MW > 1,500 and Projects_per_Million > 10. o Compute and print the average Solar_Projects_Completed for countries with Renewable_Capacity_GW > 100 GW. Question 2: An education research team compiled exam scores for 20 students across 4 subjects. The data is provided in students_scores.xlsx includes o Student: This includes the student first name. o Section: This includes the student section (A, B, C or D). o Math: This is the student’s grade in Math (integer). o Physics: This is the student’s grade in Physics (integer). o Chemistry: This is the student’s grade in Chemistry (integer). o English: This is the student’s grade in English (integer). Write a python program to 1. Read the data from the excel file into a Pandas DataFrame called StudentsScores. 2. Display the first 5 rows of the DataFrame. 3. Print a summary of the DataFrame using the describe function. The summary should include all types of data. 4. Use the shape attribute of the DataFrame to determine and print its numbers of rows and columns. 5. Conduct data analysis: o Count Section A students: determine and print how many students belong to Section A. o Lowest Math score: identify the student with the lowest Math score and print that student’s data. o Highest English score: identify the student with the highest English score and print that student’s data. o Lowest total score: compute each student’s total across all four subjects, then identify the student with the lowest total, and print that student’s data.
XYZ
$ 25
Description: This assignment helps understand Processing and plotting different datasets using Python.
Problem Statment : Question 1: In this question, you will use the "Titanic" dataset. This dataset contains information on 891 passengers, with the following columns: Column Description sex Gender (“male” or “female”) age Age in years (float; some missing) sibsp Number of siblings/spouses aboard parch Number of parents/children aboard fare Ticket fare in British pounds embarked Port of embarkation (“C” = Cherbourg; “Q” = Queenstown; “S” = Southampton) class Passenger class (“First”, “Second”, or “Third”) alone Was the passenger travelling alone (True or False) survived Survival indicator (0 = No, 1 = Yes) Write a Python program to perform the following tasks/answer the following questions: 1. Load the dataset into a Pandas DataFrame and display the first five rows. 2. Plot a pie chart showing the percentage of passengers who embarked at each port. 3. Create a barplot showing the number of passengers travelling in each class. 4. Create a scatter plot of age vs. fare, colored by class. Based on this plot, state which passenger class generally paid the highest fares. 5. Calculate and print the mean and five-number summary of fare using the describe() command. 6. Create a box plot of fare and identify any outliers. 7. Plot a histogram of age and describe its distribution shape. 8. Filter the female passengers data and create a bar plot of their class counts. 9. Filter the male passengers data and create a bar plot of their class counts. Compare the two distributions. 10. Generate a heatmap of correlations among the numeric features of the data frame (age, fare, sibsp, parch); identify the strongest and weakest correlations. Question 2: In this question, you will use the "Penguins" dataset. The dataset contains measurements for penguin specimens from three islands in Antarctica. Each row represents one penguin. The data provided include: Column Description species Penguin species (Adelie, Chinstrap, Gentoo) Island Island where the penguin was observed (Torgersen, Biscoe, Dream) bill_length_mm Bill length in millimeters (float) bill_depth_mm Bill depth in millimeters (float) flipper_length_mm Flipper length in millimeters (float) body_mass_g Body mass in grams (float) sex Sex of the penguin (male, female) Write a Python program to perform the following tasks/answer the following questions: 1. Load the dataset from penguins.csv into a Pandas DataFrame and display the first five rows. 2. Use the command info() to print a description of all columns. How many penguins are included in this data frame? 3. Construct a pie chart showing the proportion of each penguin specie. 4. Build a bar plot of penguin counts by island. 5. Calculate and print the mean and five-number summary of bill_length_mm using describe(). 6. Construct a box plot of flipper_length_mm. From the box plot, identify if there are any outliers. 7. Plot a histogram of body_mass_g. Based on this plot, describe the distribution of the penguins body mass. 8. Filter the data frame to "Adelie" penguins and plot a histogram of their body_mass_g. 9. Filter the DataFrame to "Gentoo" penguins and plot a histogram of their body_mass_g. Compare with the histogram in part (8) and state which specie tend to be heavier. 10. Generate a heatmap of the correlation matrix among all numeric variables (bill_length_mm, bill_depth_mm, flipper_length_mm, body_mass_g); from the heatmap, identify the strongest correlation and the two weakest correlations.
XYZ
$ 25

Description: The Contact List Manager is a Python program designed to help users manage their contacts efficiently. The program allows users to perform various operations such as viewing, adding, updating, and searching for contacts stored in a text file. The program reads contact information from a file named "contacts.txt," which contains names and phone numbers separated by commas. The interface is user-friendly and menu-driven, making it easy for users to navigate and perform tasks without confusion.
Problem Statment : Design a simple Python program to manage a contact list using a text or CSV file. The program should allow users to add, view and update the contacts. Users can enter a name and phone number while the program validates input to prevent empty names, incorrect phone numbers, and duplicate entries. Contacts should be displayed in a structured format, and users should be able to search for a contact by name. The interface should be userfriendly.
XYZ
$ 25
Description: The implementation of a C# program, which focuses on using classes to generate and manipulate objects, is detailed in this report. Constructors, methods, and an override ToString function have to be added to a Student class based on a UML model that was given. As part of the software, it was required to create objects, set their attributes, compare their GPAs, and show their data.
Problem Statment : a) Write a C# code for the following UML class: (6 marks) Student - id : String - name : String - GPA : double + Student (id) + Student (id, name) + setName (name: String) + setGPA (value: double) + getGPA( ): double + getName ( ) : String + isHigher (av: double) : Boolean + ToString ( ): String b) Write the statement(s) needed for the following questions (total 6 marks): a) (2 marks) Create two objects named (maleStudent) and (femaleStudent) using different constructors with ant values you select. b) (0.5 mark) Set any name for the object created by the first constructor. c) (0.5 mark) Set the GPA of both objects for any values. d) (1 mark) Call isHigher method and print appropriate message. e) (0.5 mark) Display the GPA of the femaleStudent. f) (0.5 mark) Display the name of the maleStudent. g) ( 1 mark) Display the information (fields) of one of the objects explicitly and the other object implicitly.
Prince Mohammad Bin Fahd University
$ 25
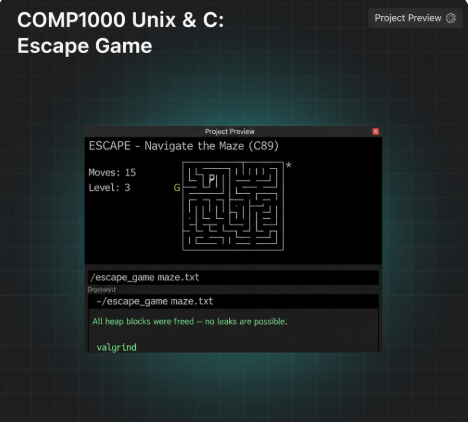
Description: This report and assignment specification detail the development of "Escape," a terminal-based ASCII maze game created for the Unix & C Programming (COMP1000) course. Built using the C89 standard, the game requires players to navigate a character ('P') through a grid toward a goal ('G') while avoiding rotating enemies that can detect the player's movement. The project emphasizes professional software engineering practices, including dynamic memory management (malloc/free) to prevent leaks, modular code design with separate header files, and the implementation of a generic linked list to support a multi-step "undo" feature.
Problem Statment : Your task for this assignment is to design, code (in C89 version of C) and test a program. In summary, your program will: • Able to create dynamically-allocated 2D char array to make a simple ASCII-based game. • Receive user input to control the game. • Use pre-written random number generator to initiate components in the game. • Write a proper makefile. Without the makefile, we will assume it cannot be compiled and it will negatively affect your mark. • Extract information from a text file to initialize the game. • Do a simple animation with sleeping feature in C. • Utilise linkedlist data structure to keep track the game progress, allowing the Player to undo the steps taken.
Curtin University
$ 25

Description: The task was to create a Java program that models a deck of playing cards, similar to those used in games like Poker or Blackjack. The program consists of four main components: the Card class, the Deck class, the DeckDriver class (which contains the main method), and the SuitType enumeration. The goal was to implement these classes based on the provided API, ensuring proper functionality for creating, shuffling, and dealing cards.
Problem Statment : Deck of Cards Write a program using Intellij to model a deck of playing cards-the kind used in Poker or Black Jack, Download this API and unzip the file CardDeckAPL.zip Double-click on index.html to open the API. This API describes the four elements of this project: (1) the Card class, (2) the Deck class, the DeckDriver class (which contains the main method and may be renamed to your default IDE's main class name), and (4) the Sust Type enumeration Start by creating a project and add the following to the project: Asuit Type enum definition given here SuitType.java This is the enumerated type definition for a playing card's suit A Card class to represent one playing card. This class should have two constructors and a tostring method. Refer to the API to understand what these methods do A peck class to represent a deck of playing cards. Lise an array (not ArrayList) to store the cards. In addition, store the current number of cards in the deck as a second instance variable, as cards are dealt, this integer will decrease. It should contain a constructor and the following methods: shuffle, deal, getSize, hazMoreCards, tostring. Refer to the API to understand what all these methods do The main method should. Instantiate an ArrayList to hold Cazu objects, ne main method snoulS instantiate an arrayList to hold Card objects instantiare the best of Cara objects shuffle the after shuffling, deal each card from the Deck and assign each card to the ArrayList after the ArrayList is filled, print the contents of the ArrayList, one Card at a time Be sure appropriate comments are in place. Add Javadoc for each class, and each method within every class. Submission: Coding guidelines Use only constructs and syntax from the textbook or from class lectures Use descriptive identifiers -Use letter-case standards for naming variables, classes, and methods -Write efficient code, do not re-create code when similar code already exists -Use white space effectively indenting blocks of code and blank lines between major sections of code Comments Add inline or block comments and non-trivial parts of your code. Testing Record your program running to prove it is running as expected, each time clearly explaining whether the output as correct or not, and why. There is no need to explain the code Academic fionesty This work is to be completed by you alone without the help of an internet resource, a friend, family member, or dassmate You may get help from the instructor, preceptor, or an official UHart tutor Any violation of the academic honesty policy will result in disciplinary actions as outlined on the syllabus Prepare for submission: Download DBS if you haven't done so Change Settings > Output> Recording Format to mp4. Add Sources > Display Capture. Note that only MP4 videos are accented --- PAGE 2 --- Download QBS you haven't done so. Change Settings > Output > Recording Format to mp4. Add Sources > Display Capture. Note that orily MP4 videos are accepted Record your program running by testing your code as explained earlier. Be sure to narrate and discuss and analyze the output, there is no need to explain your code. Be sure that audio is clear and audible. Test the MP4 to make sure video and audio work property. Limit your video to 2 minutes. If your code does not run or does not compile, create a video explaining how far you got with the code, and what happens or does not happen when program is compiled/ran Zip your entire Intellij project for this work producing a zip file. No other extensions or formats are accepted. If I unzip this file, I should be able to open your entire project using Intellij and run your code directly a. To zip a folder on Windows, right-click the folder (that contains the entire project) in File Explorer, select "Send to, and then choose "Compressed (zipped) folder This will create a new zip file with the same name as the folder, in the same location, as a compressed archive. b To zip a folder on a Mac, simply contral-click (right-click) the folder (that contains the entire project) and choose "Compress" from the shortcut menu. A new zip file with the same name (or "Archive.zip" if you're compressing multiple items) will be created in the same location Every entry below must be filled Question 1 Select one that best describes your project. Be clear and precise to get full points. [x] Code complies, rested thoroughly with varied test cases, and works according to the exact specification above [x]) Code compiles but does not pass some test cases 5 Points
XYZ
$ 25

Description: Untitled
Problem Statment : Problem 1: Please finish the tasks below using both Python and R: 1. Generate a 150 by 1 vector following standard normal distribution. (Please set a random seed to make your generation reproducible) 2. Output its average, variance, quartile, and mean absolution deviation. 3. Make a histogram for the data you generated. 4. Convert this vector to a 50 by 3 data frame and print it. 5. Assume each column represents a group. Make a boxplot to compare these groups, and describe your observations. Problem 2: Please finish the tasks below using both Python and R: 1. Input the data below (the first row is the name of each variable). 2. Select two variables and make a scatter plot. (e.g., "mpg" and "cy!") 3. Perform PCA to extract features from the data (using the first three PCs), and print the features (1.e., the PC scores).
XYZ
$ 25
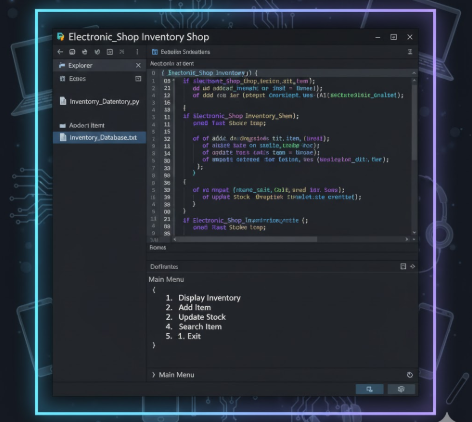
Description: This report details the development of an Electronic Inventory Shop system, a Java-based application designed to categorize sales based on customer age. The project utilizes Java Swing to create a custom graphical user interface (GUI) that sorts purchases into two distinct categories: a "Kids List" for children aged 11 or younger and an "Items List" for older customers. Key features include: Age-Based Categorization: Logic that automatically sorts products like toy balls into the Kids List and more advanced items like remote-controlled cars into the Items List. Custom GUI Design: A manually structured interface using JPanel and other Swing components to handle user inputs effectively. Inventory Management: A simplified retail system focused on tracking age-appropriate product sales and purchasing patterns. Educational Foundation: A demonstration of applying conditional logic and GUI design to solve practical retail management problems.
Problem Statment : Background In a retail environment, managing inventory effectively often requires categorizing sales based on customer demographics to better understand purchasing patterns and ensure age-appropriate product distribution. For an electronics shop, distinguishing between items bought by children and those bought by older customers is essential for organizing stock and tailoring marketing strategies. Manual tracking of these demographics can be inefficient and prone to error, necessitating a digital solution to streamline the process. Problem Current inventory methods at the shop do not automatically differentiate between products based on the buyer's age, leading to a disorganized sales record where simple toys and advanced electronics are grouped together. There is a need for a software-based system that can capture user input and apply conditional logic to sort items into distinct categories automatically. Goal The objective is to develop a Java-based Electronic Inventory Shop application using Java Swing to create a user-friendly graphical interface. The system must: Capture User Input: Allow the entry of item details and the age of the customer. Apply Conditional Logic: Automatically categorize purchases based on age; specifically, items bought by children aged 11 or younger must be placed in a "Kids List". Categorize Advanced Items: Place items bought by customers older than 11 into a separate "Items List" with additional specifications. Display Results: Provide a clear visual output (via JPanel) that shows the organized inventory, facilitating easier tracking and management of age-appropriate sales.
XYZ
$ 25
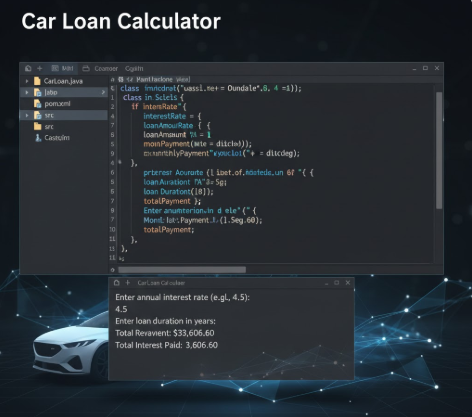
Description: A comprehensive walkthrough for setting up and running a Java car loan calculator project. This guide covers environment configuration, file preparation, and a detailed explanation of loan amortization calculations, including monthly payments and interest overpayment.
Problem Statment : Car Loan Write a Java program using [intelli] that calculates a monthly car payment; we will assume that the interest rate is compounded monthly. Use the Scanner class to receive the input and produce the output using System.out.println. 1. Prompt the user for a double value representing the annual interest rate in percentage. For example, user enters 5 for 5%. 2. Prompt the user for an integer value for the number of years the car loan will be held (typical input here is 3 or 5). 3. Prompt the user for a double value representing the car loan amount borrowed from the bank. 4. Calculate the monthly payment using the formula: o Monthly payment = (mIR * P) / (1 - (1 / (1 + mIR)(12 * nOY))), where: o mIR = monthly interest rate = annual interest rate / 12 (Note that the interest rate should be stored as a decimal. For example, 0.05 for 5%). o nOY = number of years o P = car loan amount (also called the principal) o Hint: The Math class has a pow method (power) that you should use here 5. Output a summary of the car loan results as follows: o the annual interest rate in percent notation o the car loan amount in dollars o the number of monthly payments (no decimal places) o the month payment in dollars with exactly two significant digits after the decimal point o the total payment over the years with exactly two significant digits after the decimal point o the overpayment, i.e., the difference between the total payment over the years and the car loan amount, with exactly two significant digits after the decimal point o the overpayment in percentage (in percent notation) of the car loan amount, i.e., the ratio between the overpayment and the total payment o Format currency and percentages appropriately, using $ and % where necessary. Number formatting reference is available on the Java API. 6. Format the input (including prompts) and output as shown on the sample below. Numeric outputs are formatted using the DecimalFormatter class. 7. Comment your code properly. Sample execution: CAR LOAN PROGRAM ===================================== Enter the interest rate: 3.5 Enter the number of years for the loan: 5 Enter the car loan amount: 45,999 ===================================== Annual Interest Rate = 3.5% Car Loan = 45999.00 NumberofmonthlyPayments=60 MonthlyPayment= $836.80 Total Payment = $50208.12 Overpayment = $4209.12. Overpayment in % = 8.38%
XYZ
$ 25

Description: A detailed technical guide for setting up a role-based AppleStore management system and a Java-based car loan amortization calculator, covering environment setup, source code logic, and financial testing scenarios.
Problem Statment : Introduction The goal of this project assignment is to consolidate the knowledge and skills you learned throughout the course. You will be implementing a Java application for managing a store in two phases. A team of two students will work together on each phase without any external help except from the course instructor or TA. The theme of the store and the content will be chosen by the team. The objective of this first phase of the project is to develop the following skills. Ability to design and implement larger applications using the Object-Oriented Programming (OOP) Paradigm. Use UML class diagrams to design applications. Ability to test and debug applications. Ability to save application data to and load them from stored files. Ability to work in teams. This assignment counts as 10 points of your final grade. The remainder of this document will describe the requirement for this project (Phase 1). Store Name and Contents Your first task is to decide on the type of content you want to sell on the store. This will determine how your items are printed (and displayed in Phase 2), and how your store will be organized. You should explicitly list all item that will be available. In addition, you will need to chose a name for your store. System Specification Your application must support the following features: Allows loading the application data from a file (if the file is not specified load the data from the file ''store.data'') Allows saving the application data from a file (if the file is not specified save to the default file'store.data'") There are three types of users: Managers, Employees, and Customers. All users have an and a name. Managers and Employees need to login with an ID and a password ID . Customers only need their ID to login. All users can perform the following - List store items by category - Search store items by name or price, or any attribute you think is important for your specific store. - log out • In addition, Managers and Employees can perform the following - Add store items - Remove store items Create a new Customer account • Managers can add and remove users (i.e, Managers, Employees, Customer), except themselves If there is no file to load data from, by default the store will have no items and only a single Manager user named "owner" with an ID "1", and a password "owner".
XYZ
$ 25

Description: A technical walkthrough for setting up a Java-based management system that tracks customer records, purchases, and loyalty points using a GUI-driven interface and object-oriented programming.
Problem Statment : Java Based Jewelry shop management system where, The Jewelry Shop Management System is a Java-based application designed to help jewelry store owners efficiently manage customer information, sales records, and loyalty programs. Traditional methods of record-keeping, such as manual logs or spreadsheets, are often prone to errors and inefficiencies. This system provides a digital solution by storing customer details, purchase history, and loyalty points in an organized manner. The program uses file handling to ensure data is saved permanently, even after the application is closed. By automating key tasks like loyalty point calculations and sales tracking, the system reduces manual work and minimizes mistakes. The goal of this project is to create a simple yet effective tool that improves the daily operations of small to medium-sized jewelry businesses.
XYZ
$ 25
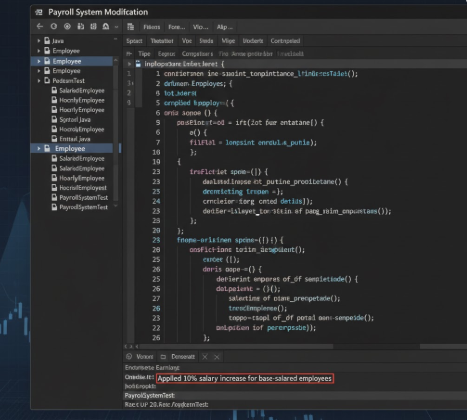
Description: A technical guide for implementing a Java-based payroll system that utilizes inheritance and polymorphism to calculate earnings for various employee types, including salaried, hourly, and commission-based staff.
Problem Statment : A payroll system modification which is a Java-based program designed to manage different types of employees and calculate their earnings based on their employment category. The system uses object-oriented programming (OOP) principles such as inheritance, polymorphism, and abstraction to handle various employee types, including salaried employees, hourly employees, commission employees, base-pluscommission employees, and piece workers. The program demonstrates how different employee classes can extend a common superclass while implementing their own earnings calculation logic. Additionally, it showcases polymorphic processing by treating all employee objects uniformly while still executing their specific methods.
XYZ
$ 25
Description: A comprehensive guide for processing GRACE-FO satellite data using MATLAB to compute inter-satellite range, range-rate, and ground station visibility, featuring numerical differentiation and orbital visualization.
Problem Statment : Background The Gravity Recovery And Climate Experiment (GRACE) mission was launched by NASA in 2002. The primary objective of GRACE was to measure variations in Earth’s gravity field to track mass changes in the hydrosphere, cryosphere,solid Earth, and oceans. In contrast to single satellite approaches with one dedicated sensor, GRACE used a constellation of two satellites, orbiting one behind the other, featuring a suite of measurement systems. GRACE mission ended in July 2017. The GRACE FollowOn (GRACE-FO) mission, which launched May 22, 2018, will continue the work of GRACE mission. GRACE and GRACE-FO are very similar satellite missions. Each satellite mission consists of two identical satellites flying in the same near-polar orbit at about 500 km altitude, one following the other at a distance of about 220 km (see Figure 1 below). Both satellites are equipped with (1) GPS to measure their position and (2) accelerometers (placed at the center of mass of the satellite) to measure nongravitational forces like air drag acting on the satellites. The principal observation of the GRACE and GRACE-FO missions is the ultra-precise measurement of inter-satellite distance between the two satellites. Distance between the two satellites changes because of the gravitational pull of the masses beneath the satellites. Therefore, tracking the change in the inter-satellite distance enables us to measure mass changes that happen on or near the Earth’s surface. Surface mass changes are caused by various processes like the Greenland icesheet melting due to global warming and climate change or groundwater depletion in California’s Central Valley due to overpumping of groundwater used for irrigation. GRACE-FO Orbit Data from NASA Jet Propulsion Laboratory (JPL) The files “GNV1B_2024-02-22_C_04.txt” and “GNV1B_2024-02-22_D_04.txt” provide the orbits of GRACE-FO satellite #1 and #2 (also known as GRACE-FO satellite C and D) on 22 February 2024, respectively, released by NASA Jet Propulsion Laboratory (JPL). The files include the position and velocity vector (as well as their error information) of each satellite every second and the time (epoch) of position/velocity vectors. The time is given as seconds passed since 01-Jan-2000 11:59:47 UTC. Position and velocity vectors are given in the Earth-Centered Earth-Fixed (ECEF) geocentric coordinate system: The Z axis is the line between the North and South Poles (with positive values increasing northward), the X axis is in the plane of the equator, passing through the origin and prime meridian (Greenwich), and the Y axis in the plane of the equator, extending from 90°W longitude to 90°E longitude (positive). The MATLAB function “ReadGFO_Orbit.m” provided to you reads the information given in the GRACE-FO orbit files and outputs the time (in decimal year) as well as position and velocity vector of the GRACE-FO satellites #1 and #2 (also known as satellites C and D). You will use this function to extract the information required for the programming tasks described below from the GRACE-FO files. ASEN 1320 Aerospace Computing and Engineering Applications Spring 2025 Figure 1. GRACE and GRACE-FO measurement is implemented by two identical satellites orbiting one behind the other in a near-polar orbit plane at ~500 km altitude. The along-track separation is kept within a range of 220 ± 50 km. The satellites experience positive and negative, gravitationally induced, along-track accelerations due to the varying mass distribution below them. Each satellite will experience the effects of the local mass at slightly different times causing a differential acceleration. The differential acceleration, in turn, causes distance (range) variations and velocity differences Δv that are proportional to the mass attraction related to the gravitational potential, U. The relative distance between the satellites is measured with micron-level precision by a high accuracy dual frequency K-band inter-satellite ranging system. An accurate three-axis accelerometer measures the effects of all non-gravitational forces acting on each satellite, including atmospheric drag, direct and Earth-reflected solar radiation pressure, and thrusting. A GPS receiver on each satellite provides position and time synchronization. The satellites overfly the entire Earth surface within approximately 30 days, allowing monthly estimates of a global gravity model with a surface spatial resolution of about 300 km with an accuracy of 2 cm. [Reference: Tapley et al., 2019]. ASEN 1320 Aerospace Computing and Engineering Applications Spring 2025 Programming Tasks Write six user-defined MATLAB functions and a main program to perform the programing tasks described below. All the user-defined functions should be called inside the main function to perform the required actions. [5 points for calling the functions in the main program] 1. Review the function called ReadGFO_Orbit (provided to you) with the following input and output parameters: Input A string variable called InFilename, indicating the name of the GRACE-FO orbit text file (for example, “GNV1B_2024-02-22_C_04.txt”). Output A column vector called t_dy, indicating the time (epoch) of satellite position/velocity measurements converted to decimal year. A matrix (with 3 columns) called r, indicating the position [x y z] of GRACE-FO satellite. The number of rows in this matrix is equal to the number of position measurements of GRACE-FO satellites given in text file (which is equal to 86400: 1 position per second). A matrix (with 3 columns) called v, indicating the velocity [Vx Vy Vz] of GRACE-FO satellite. The number of rows in this matrix is equal to the number of velocity measurements of GRACE-FO satellites given in the text file (which is equal to 86400). This function will read the data from the text files “GNV1B_2024-02-22_C_04.txt” and “GNV1B_2024-02-22_D_04.txt” and extract time (and will convert it to decimal year) and position and velocity vector of the GRACE-FO satellite #1 and #2. Therefore, this function should be called twice in the main program. The MATLAB function “ReadGFO_Orbit.m” (provided to you) performs this programming task for you. Please go through this function carefully to make sure that you fully understand the MATLAB built-in functions used in this user-defined function. 2. Write a function called GFO_Range with the following input and output parameters: [10 points] Input A matrix (with 3 columns) called r1, indicating the position [x1 y1 z1] of the GRACE-FO satellite #1. A matrix (with 3 columns) called r2, indicating the position [x2 y2 z2] of the GRACE-FO satellite #2. Output A column vector called Rho, indicating the inter-satellite range (distance) between the two GRACE-FO satellites. This function will compute the inter-satellite range (distance) 𝜌𝜌 using the following equation: 𝜌𝜌 = �(𝑥𝑥2 − 𝑥𝑥1)2 + (𝑦𝑦2 − 𝑦𝑦1)2 + (𝑧𝑧2 − 𝑧𝑧1)2 3. Write a function called GFO_RangeRate with the following input and output parameters: [15 ASEN 1320 Aerospace Computing and Engineering Applications Spring 2025 points] Input A matrix (with 3 columns) called r1, indicating the position [x1 y1 z1] of the GRACE-FO satellite #1. A matrix (with 3 columns) called r2, indicating the position [x2 y2 z2] of the GRACE-FO satellite #2. A matrix (with 3 columns) called v1, indicating the velocity [Vx1 Vy1 Vz1] of the GRACE-FO satellite #1. A matrix (with 3 columns) called v2, indicating the velocity [Vx2 Vy2 Vz2] of the GRACE-FO satellite #2. Output A column vector called Rho_dot, indicating the inter-satellite range-rate. This function will compute the inter-satellite range-rate 𝜌𝜌̇ using the following equations: 𝜌𝜌̇ =< 𝚫𝚫𝒗𝒗 ⋅ 𝒆𝒆𝟏𝟏𝟏𝟏 𝐋𝐋𝐋𝐋𝐋𝐋 > where < ⋅ > indicates the dot product and 𝚫𝚫𝒗𝒗 and 𝒆𝒆𝟏𝟏𝟏𝟏 𝐋𝐋𝐋𝐋𝐋𝐋 are defined as 𝚫𝚫𝒗𝒗 = 𝒗𝒗𝟐𝟐 − 𝒗𝒗𝟏𝟏 = [𝑉𝑉𝑥𝑥2 − 𝑉𝑉𝑥𝑥1 𝑉𝑉𝑦𝑦2 − 𝑉𝑉𝑦𝑦1 𝑉𝑉𝑧𝑧2 − 𝑉𝑉𝑧𝑧1] 𝒆𝒆𝟏𝟏𝟏𝟏 𝐋𝐋𝐋𝐋𝐋𝐋 = 𝚫𝚫𝒓𝒓 𝜌𝜌 = 𝒓𝒓𝟐𝟐 − 𝒓𝒓𝟏𝟏 𝜌𝜌 = [ 𝑥𝑥2 − 𝑥𝑥1 𝜌𝜌 𝑦𝑦2 − 𝑦𝑦1 𝜌𝜌 𝑧𝑧2 − 𝑧𝑧1 𝜌𝜌 ] 𝚫𝚫𝒓𝒓 = 𝒓𝒓𝟐𝟐 − 𝒓𝒓𝟏𝟏 = [𝑥𝑥2 − 𝑥𝑥1 𝑦𝑦2 − 𝑦𝑦1 𝑧𝑧2 − 𝑧𝑧1] 𝚫𝚫𝒗𝒗 is the relative velocity vector between the two satellites and 𝒆𝒆𝟏𝟏𝟏𝟏 𝐋𝐋𝐋𝐋𝐋𝐋 is the unit vector pointing from GRACE-FO satellite #1 to satellite #2. 4. Write a function called GFO_NUmDiff with the following input and output parameters: [15 points] Input A scalar variable called dt, indicating the sampling rate (in seconds) of position and velocity vectors given in the GRACE-FO orbit files (which is equal to 1 second). A column vector called Rho, indicating the inter-satellite range (distance) between the two GRACE-FO satellites. A column vector called Rho_dot, indicating the inter-satellite range-rate. Output A column vector called Rho_dot_ND, indicating the inter-satellite range-rate computed from inter-satellite range 𝜌𝜌 using numerical differentiation (see 𝜌𝜌̇ 𝑁𝑁𝑁𝑁 below). A column vector called Rho_dot_diff, indicating the difference between Rho_dot_ND and Rho_dot (= 𝜌𝜌̇ 𝑁𝑁𝑁𝑁 − 𝜌𝜌̇). This function will compute the inter-satellite range-rate from inter-satellite range 𝜌𝜌 using numerical differentiation as follows (𝑁𝑁 is equal to the number of epochs (86400) in the GRACE-FO orbit files): ASEN 1320 Aerospace Computing and Engineering Applications Spring 2025 𝜌𝜌̇𝑁𝑁𝑁𝑁(𝑡𝑡𝑖𝑖) = 𝜌𝜌̇𝑁𝑁𝑁𝑁(𝑡𝑡1) = 𝜌𝜌(𝑡𝑡2) − 𝜌𝜌(𝑡𝑡1) 𝑑𝑑𝑑𝑑 𝜌𝜌(𝑡𝑡𝑖𝑖+1) − 𝜌𝜌(𝑡𝑡𝑖𝑖−1) 2𝑑𝑑𝑑𝑑 ; 𝑖𝑖 = 2, 3, 4, … , 𝑁𝑁 − 1 𝜌𝜌̇𝑁𝑁𝑁𝑁(𝑡𝑡𝑁𝑁) = 𝜌𝜌(𝑡𝑡𝑁𝑁) − 𝜌𝜌(𝑡𝑡𝑁𝑁−1) 𝑑𝑑𝑑𝑑 This function will also compute Rho_dot_diff which is equal to 𝜌𝜌̇𝑁𝑁𝑁𝑁 − 𝜌𝜌̇. 5. Write a function called SatVisibility with the following input and output parameters: [15 points] Input A 1×3 row vector called rG, indicating the ECEF position [xG yG zG] of the Satellite Laser Ranging (SLR) station in Maryland, U.S.A. rG = [1130714.219 -4831369.903 3994085.962]. A matrix (with 3 columns) called r1, indicating the position [x1 y1 z1] of the GRACE-FO satellite #1. Output A column vector called el, indicating the elevation angle (in degrees) of the GRACE-FO satellite #1 from the SLR station in Maryland. A column vector called index_vis, indicating the index of elevation angles greater than 10 degrees in the column vector el. Such elevation angles indicate the epochs of GRACE-FO satellite #1 visible from the SLR station. The SLR technique measures the distance between the station and satellites using the laser pulses when the satellite is visible from the station. This function will first compute the elevation angle of the GRACE-FO satellite #1 with respect to the SLR station in Maryland as follows: 𝑒𝑒𝑒𝑒 = arcsin � 𝑧𝑧1 − 𝑧𝑧𝐺𝐺 𝑑𝑑 � 𝑑𝑑 = �(𝑥𝑥1 − 𝑥𝑥𝐺𝐺)2 + (𝑦𝑦1 − 𝑦𝑦𝐺𝐺)2 + (𝑧𝑧1 − 𝑧𝑧𝐺𝐺)2 where [𝑥𝑥1 𝑦𝑦1 𝑧𝑧1] and [𝑥𝑥𝐺𝐺 𝑦𝑦𝐺𝐺 𝑧𝑧𝐺𝐺] indicate the position of GRACE-FO satellite #1 and SLR station, respectively. The function will also return the index of elevation angle values index_vis in the column vector el that are greater than 10 degrees. 6. Write a function called writeGFO_CSV with the following input parameters: [10 points] Input A string variable called OutFilename, indicating the name of the csv file with 3 columns which will be used to store the values of column vectors t_dy, Rho, and Rho_dot. A column vector called t_dy, indicating the time (epoch) of satellite position/velocity measurements in decimal year. A column vector called Rho, indicating the inter-satellite range (distance). A column vector called Rho_dot, indicating the inter-satellite range-rate. Output: No output arguments. This function will write the values in column vectors t_dy, Rho, and Rho_dot into 3 columns of the csv file OutFilename. Use "time [dec. year]", "range [m]" and "range-rate [m/s]" as the header for each column. Call this function in the main program and use “GFO_file.csv” as the name of the output csv file. ASEN 1320 Aerospace Computing and Engineering Applications Spring 2025 7. A) In the MATLAB main program, write a code that produces a figure with 3 subplots displaying the time series of Rho [in km], Rho_dot [in m/s] and el [in degrees] with respect to time (given as hours on 22 February 2024). The elevation angles greater than 10 degrees should be marked with a different color. [15 points] B) In the MATLAB main program, write a code that produces a figure showing the ground track of GRACE-FO satellite #1 overlaid on a spatial map of the world. Portion of the ground track visible from the SLR station in Maryland with elevation angle greater than 10 degrees should be marked with a different color. Location of the SLR station should be shown with a black triangle. [15 points] To display the ground track of a satellite, the ECEF Cartesian coordinates [𝑥𝑥 𝑦𝑦 𝑧𝑧] of the satellite should be converted into the curvilinear coordinates [𝜑𝜑 𝜆𝜆 ℎ], where 𝜑𝜑 is latitude, 𝜆𝜆 is longitude and ℎ is the altitude from the Earth’s spherical surface. TIP #1: Use the MATLAB function “ecef2lla” to convert from Cartesian to curvilinear coordinates. TIP #2: Use the MATLAB function “geoplot” with latitude and longitude of the GRACE-FO satellite #1 to create this plot.
XYZ
$ 35
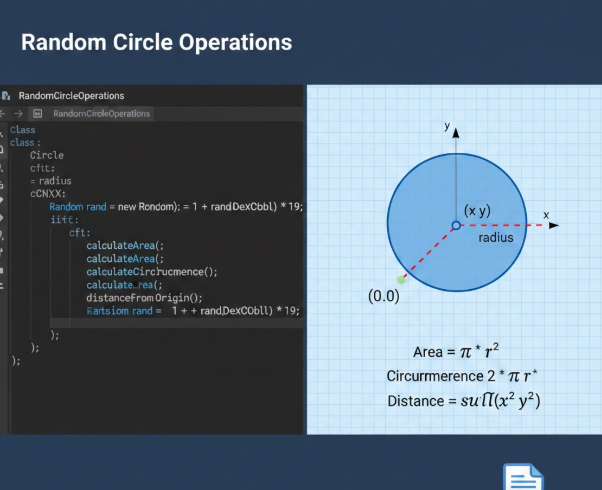
Description: Access the complete solution and guide for the RandomCircleOperations Java project. This download includes a detailed technical report explaining the implementation of the Random class for dynamic inputs and geometric formulas , along with a step-by-step walkthrough for configuring and running the project in IntelliJ IDEA.
Problem Statment : Random Circle Operations Write a Java program using IntelliJ that: • Uses the Random class to generate a random radius between 1 and 20. • Calculates the area and circumference of a circle using the radius. • Calculates the distance of a point (x, y) from the circle's center (0, 0), where x and y are random integers between -10 and 10. Display the following to the user: • The random radius. • The area and circumference of the circle. • The coordinates of the random point and its distance from the circle's center. Use the following formulas for the calculations: • Area: 𝐴𝑟𝑒𝑎 = 𝜋 ⋅ 𝑟 2 • Circumference: 𝐶𝑖𝑟𝑐𝑢𝑚𝑓𝑒𝑟𝑒𝑛𝑐𝑒 = 2 ⋅ 𝜋 ⋅ 𝑟 • Distance: 𝐷𝑖𝑠𝑡𝑎𝑛𝑐𝑒 = 𝑥 2 + 𝑦 2 Sample execution: Random radius: 12 Circle Area: 452.39 Circle Circumference: 75.40 Random point: (-7, 8) Distance from center: 10.63
XYZ
$ 25

Description: A complete solution and guide for the Student Information Management System. This download features a technical report analyzing the Object-Oriented Student class and Swing GUI implementation , alongside a step-by-step walkthrough for configuring the project in NetBeans or IntelliJ to manage student records via file I/O.
Problem Statment : Develop a java application named "Student Information Management System", where the Student Information Management System is a Java-based application designed to handle student records efficiently through a graphical user interface (GUI). This system allows users to add, load, and save student data, including details such as the student's name, ID, and GPA. The program is structured into two main components: the Student class, which defines the data model for student records, and the gui class, which provides an interactive interface for managing these records. The primary goal of this system is to simplify the process of storing and retrieving student information while ensuring data integrity through basic validation checks. The GUI makes the application user-friendly, eliminating the need for manual file editing or command-line operations.
XYZ
$ 25

Description: A complete project resource for a Number Guessing Game developed in C. This download includes a technical report detailing the logic for random number generation and input validation, along with a step-by-step walkthrough for configuring and running the code in Visual Studio Code.
Problem Statment : What am I required to do on this assessment? Complete a mini coursework exercise by developing a text-based game in C, and maintaining thorough and professional records of it’s development by populating this development log. Where should I start? Read and understand the mini coursework specification and marking criteria, and start to plan your software. This may be the first time you have created your own designs, so now you should develop software plans for how you want your game to run/play/operate. We suggest you revisit week 1 lecture about software development, to break down the task in manageable sections and develop units of software and test these and integrate them as you follow your game’s plan. What do I need to do to pass? Maintain the documentation of your software as you progress and develop your software (rather than leaving documentation until after you complete it). Please see the mark scheme for what is required in this development log. Refer to the marking criteria and achievement of the minimum mark e.g. a mark of 40% in total. How do I achieve high marks in this assessment? Ensure that you achieve most/all of the required design tasks and ensure you thoroughly document your software development process in a high level of detail. How does the learning and teaching relate to the assessment? In the portfolio of tutorial sheets, you were given small and specific software tasks. Now we advance your knowledge and allow you to design these tasks and integrate them together while applying some advanced software features (including header files). What additional resources may help me complete this assessment? Signpost to: • Supplementary study material folder on Blackboard • Engage with Espresso Programming daily support sessions (see Blackboard tab) • Make use of the reading list material
UWE Bristol
$ 25

Description: A comprehensive resource for the Vehicle Interface and Car Class implementation project. This download contains a technical report explaining key OOP concepts like encapsulation and polymorphism , along with a visual walkthrough for configuring the project in IntelliJ IDEA.
Problem Statment : Problem Statement: Vehicle and Car Interface: Vehicle Using IntelliJ, write a Java interface (not a class) called Vehicle that includes: startEngine(): A method that returns void and simulates starting the vehicle's engine. stopEngine(): A method that returns void and simulates stopping the vehicle's engine. drive(int distance): A method that returns void and accepts an integer parameter representing the distance to be driven. refuel(int amount): A method that returns void and accepts an integer parameter representing the amount of fuel to be added. Class: Car Create a Java class called Car that implements the Vehicle interface that has: Attributes: fuelLevel (int): Represents the current fuel level of the car. isEngineOn (boolean): Represents whether the car's engine is on or off. Add at least one attribute to simulate additional functionality. Implement all methods from the Vehicle interface: In the startEngine() method, set isEngineOn to true and print a message indicating the engine has started. In the stopEngine() method, set isEngineOn to false and print a message indicating the engine has stopped. In the drive(int distance) method, reduce the fuelLevel by the distance driven (1 unit of fuel per unit distance) and print the distance driven. In the refuel(int amount) method, increase the fuelLevel by the specified amount and print the new fuel level. Add at least one method to simulate additional functionality. Main Method In the main method, instantiate the Car class, and demonstrate the functionality of all the methods in the Car class by performing the following operations: Start the car's engine. Drive the car for a specified distance. Stop the car's engine. Refuel the car with a specified amount. Project Structure Your project should contain 3 files: Interface Vehicle. Class Car. Class containing the main method. Sample Run Output Plaintext Starting the car's engine... Engine started. Driving for 50 units of distance... Driven 50 units. Remaining fuel: 50 Stopping the car's engine... Engine stopped. Refueling the car with 30 units of fuel... Refueled. Current fuel level: 80 Final car status: Is engine on? false Current fuel level: 80 (Note: The sample run text is reconstructed based on the visual output described in the file ). Coding Guidelines Add Javadoc for each class and each method within every class. Use descriptive identifiers. Use letter-case standards for naming variables, classes, and methods. Use white space effectively (indenting blocks of code and blank lines between major sections). Add inline or block comments for non-trivial parts of your code.
XYZ
$ 25
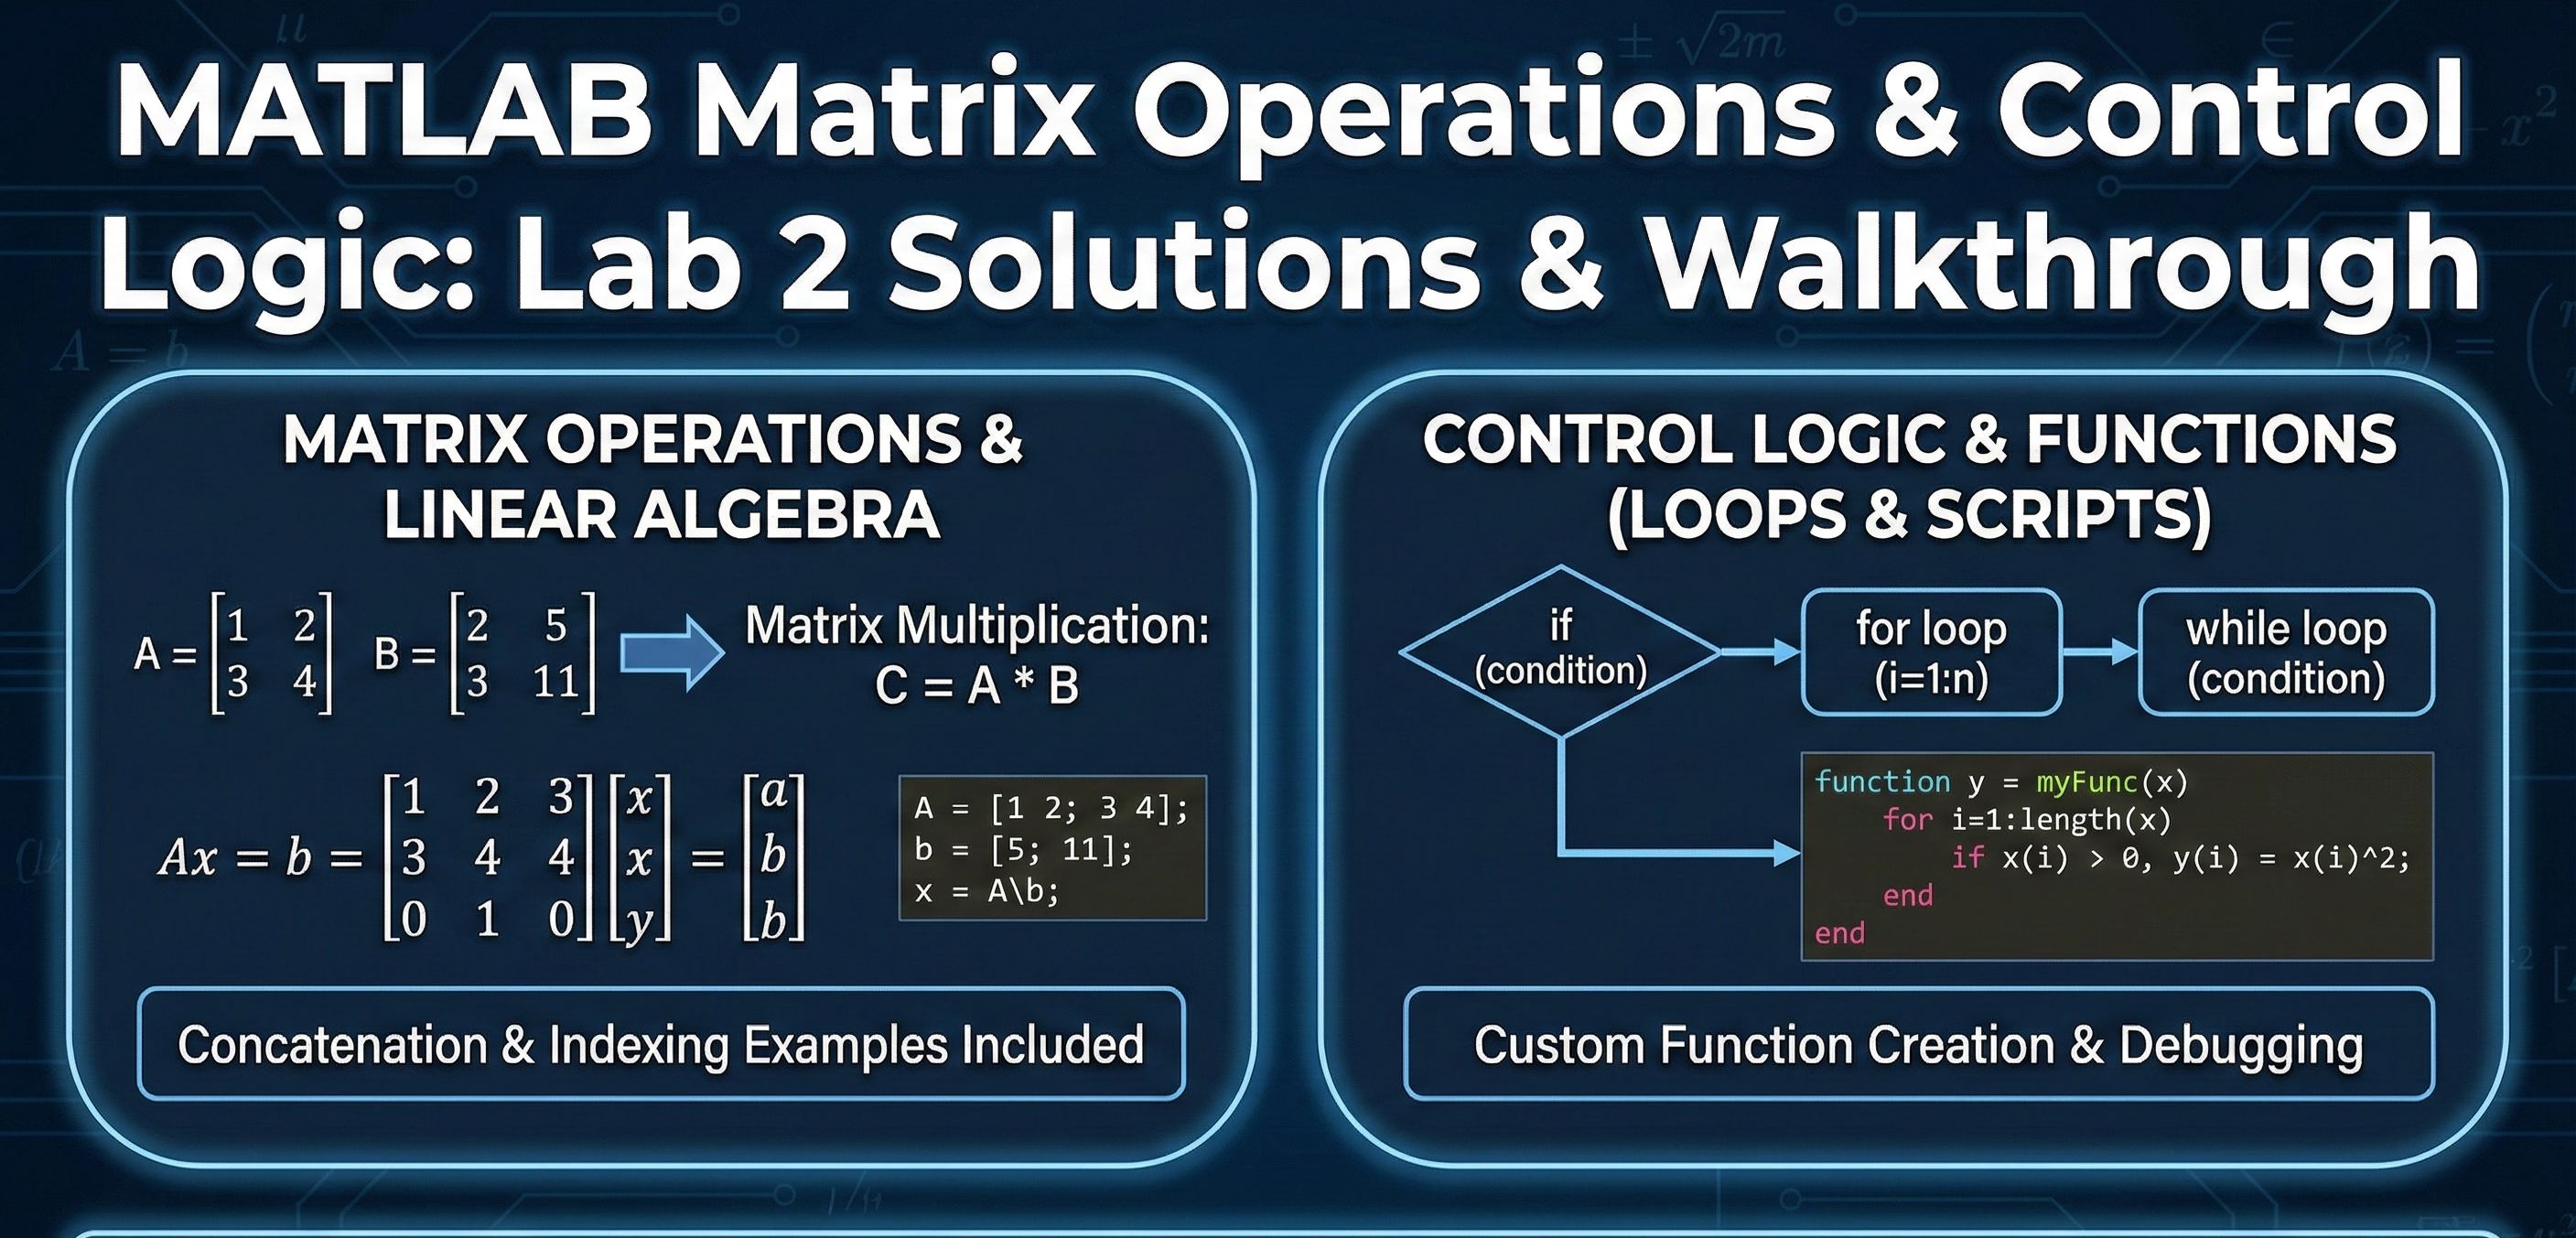
Description: A complete guide to fundamental MATLAB programming. This download includes solutions for matrix manipulation (multiplication, concatenation, indexing) and linear system solving ($Ax=b$), along with a step-by-step walkthrough for implementing control structures (for/while loops) and custom functions.
Problem Statment : The objective of this laboratory assignment is to develop proficiency in fundamental MATLAB programming and matrix algebra.The core technical challenge involves three distinct areas:Matrix Manipulation: Users must define, index, and manipulate multi-dimensional arrays, performing operations such as transposition, concatenation, and element-wise arithmetic.Linear Systems: The project requires setting up and solving systems of linear equations of the form $A\mathbf{x} = \mathbf{b}$ using MATLAB's backslash operator to find unknown vector variables.Control Logic: The final phase involves implementing algorithmic logic, specifically utilizing for and while loops to compute geometric series summations and designing a user-defined piecewise function using if-elseif-else conditional statements.
XYZ
$ 25